Reports
Inside an inventory there is a Reports page:
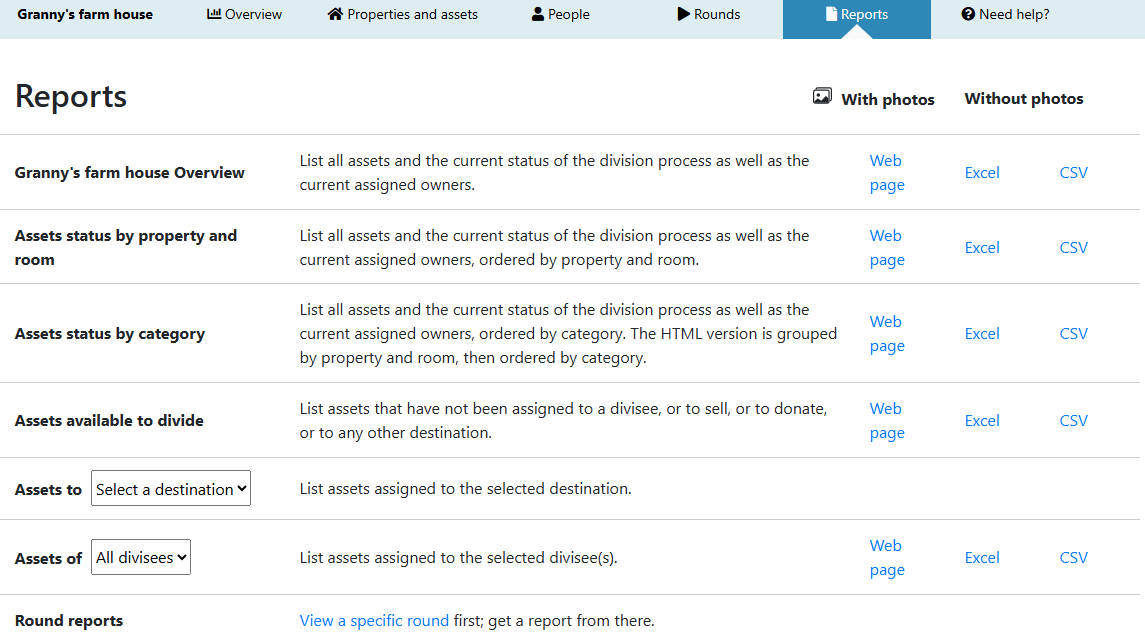
How to generate reports
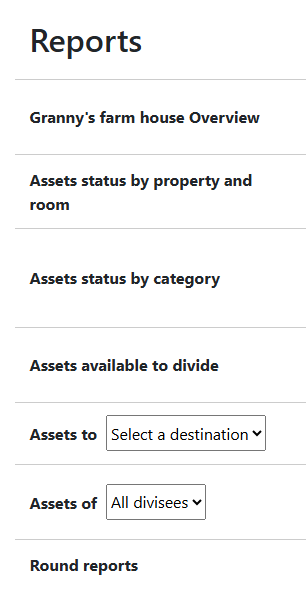
Navigate to the Reports page of your inventory. Choose a report on the left:
A couple of reports let you filter the content in a drop down box.
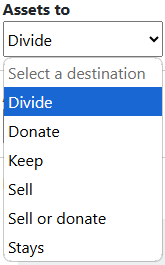
One report has a filter by disposition. Select one from the Assets to drop down:
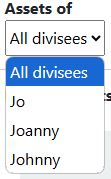
Another report filters by divisee. Select one from the Assets of drop down:
Finally, choose a file format on the right (HTML, Excel or CSV):
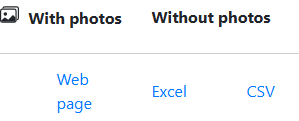
- Web page opens a new browser tab with the report and lets you add photos at the top.
- Excel will download a spreadsheet. Photos will not be included, but each asset links to the asset view in FairSplit.
- CSV is a plain, unformatted spreadsheet, mainly for computer processing. No photos and no links.
How to print or send a report with photos
After generating a report from the Reports page (see previous section), you may need to:
- print it for physical distribution, or
- save and send it digitally for record keeping, collaboration, or client communication.
This is a guide for you to print or save an HTML report.
When you generate a Web report (see previous section), a new browser tab opens.
Click Show images at the top left and choose an image size from the drop down:
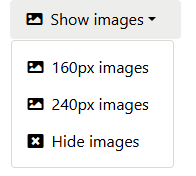
Asset images will then start downloading and appearing:
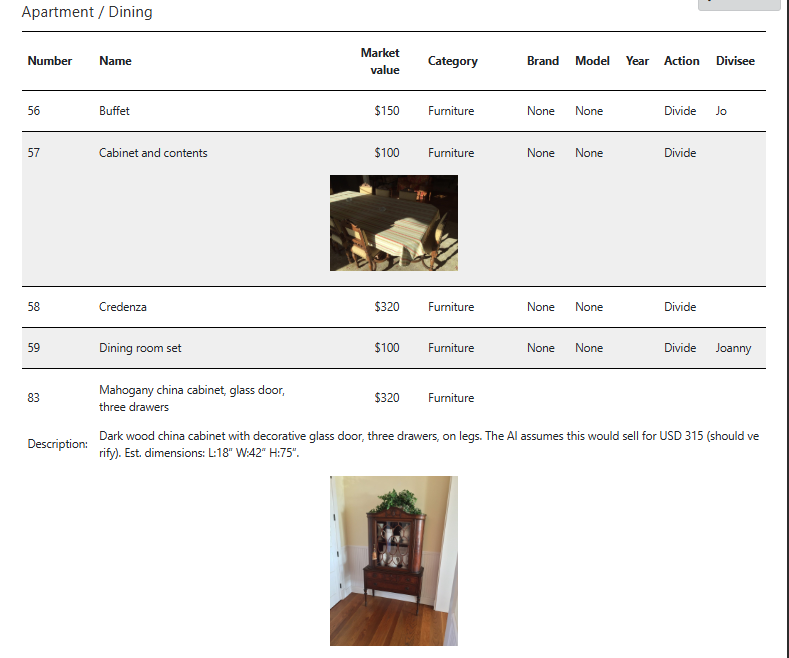
Loading the images might take a few seconds depending on the Internet connection.
After that you can push the  button on the top left.
The Print dialog from your operating system appears. You can print by clicking Print on the bottom right:
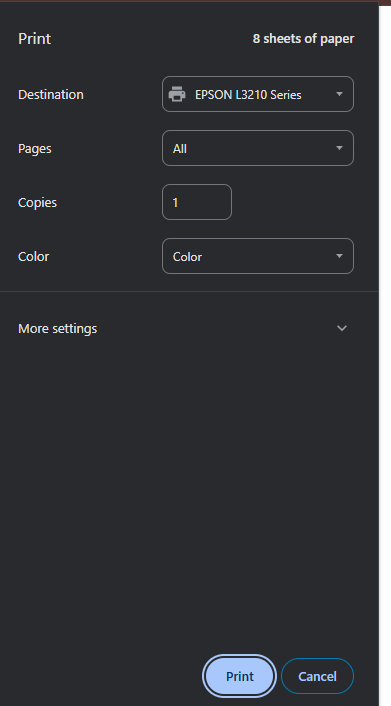
Most operating systems have, in that dialog, a "Print to file" option which, instead of printing, saves a PDF file. The specifics of how this works depend on your operating system (Windows, Mac OS X, Android etc.), not on FairSplit.
Then you can find the file and send it in your email program.
How to download an Excel spreadsheet (without photos)
You can export an inventory to an Excel spreadsheet, which is compatible with other spreadsheet applications, e.g. LibreOffice.
When you click Excel, the spreadsheet is downloaded to your computer and a toast appears. Click the Open button on the toast to open the file:

The toast is short-lived. After it disappears, you can find the downloaded Excel file by clicking the download icon on the top right corner of your browser:
![]()
Select the Excel file. This will open a spreadsheet application on your computer. You can use your application to print the spreadsheet.
What is the difference between the 2 reports of assets available to divide?
Consider these 2 sets of assets:
- Assets set to "Divide"
- Assets with unset disposition (showing "---")
The "Assets to [Divide]" report shows only the first set.
The "Assets available to divide" report shows both sets. And when a division administrator is picking the assets that will go into a new division round, the list to pick from also includes both sets.
The purpose of reports in asset division
The Reports page serves several important functions, including:
- Transparency – All parties can see who has been assigned what.
- Auditability – Records can be downloaded and kept for legal or administrative purposes.
- Progress tracking – This helps administrators monitor asset dispositions, such as which assets are still unassigned, set to divide, set to donate etc.
- Dynamic reporting – Filters by destination or divisee allow tailored views.